Tesla at $354.11: What Growth Does an EPS-Based DCF Require?
Tesla's share price reflects expectations beyond its current earnings. An interest-rate-linked, EPS-based DCF helps frame the gap—and the evidence Robotaxi and Optimus need to provide.
Interest rates change the valuation denominator
Tesla's valuation depends on both its earnings path and the discount rate applied to those earnings. A higher discount rate reduces the present value of the same future earnings. A company whose expected returns lie far into the future is particularly exposed. A fixed-rate DCF cannot capture changes in this required return as interest rates move.
The supplied model defines the discount rate as the U.S. 10-year Treasury yield plus a beta of 1.8 multiplied by an equity risk premium of 4.5%. EPS grows at 20% annually for 10 years, followed by a perpetual growth rate of 3%. A rise in Treasury yields therefore lowers the valuation even if the earnings outlook is unchanged. The displayed discount rates are rounded, and the charts reproduce the supplied DCF values.
This model uses EPS as a proxy for cash flow. It does not separately account for reinvestment, working capital or share dilution. Its results should be read as comparisons between assumptions. Earnings and cash flow can diverge substantially during a period of heavy investment.
The gap between price and DCF has changed over time
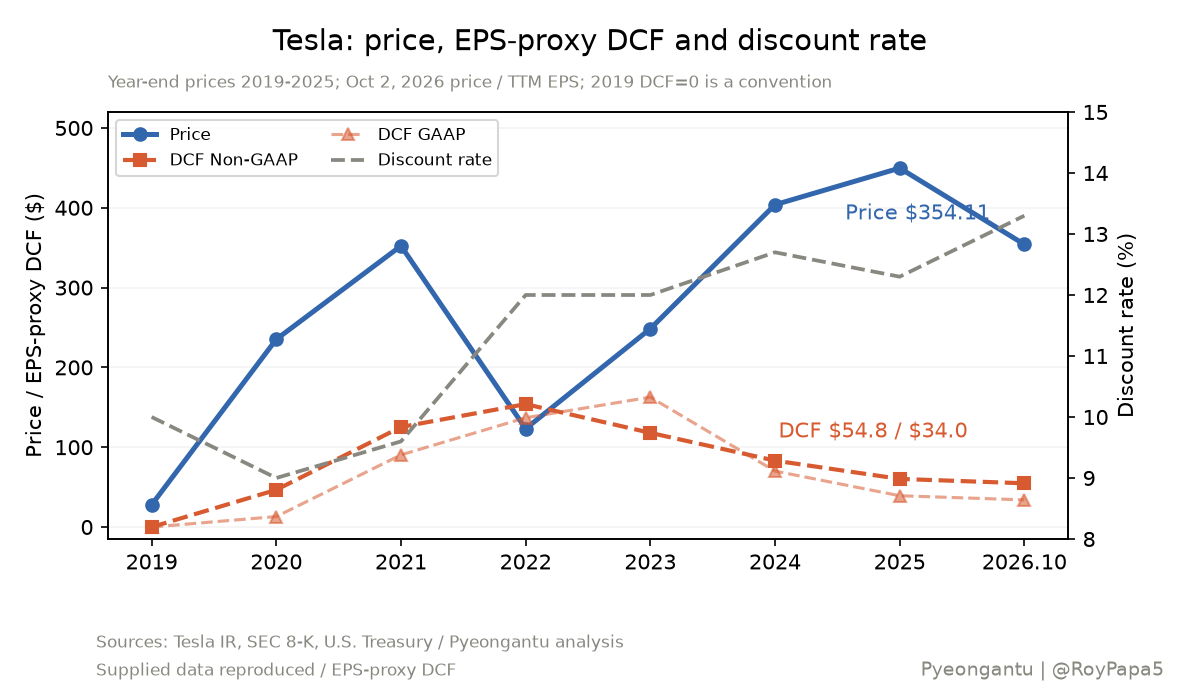
The 2020–2021 period can be interpreted as a combination of low interest rates and strong growth expectations. Discount rates were 9.0% and 9.6%, while prices of $235.22 and $352.26 exceeded Non-GAAP DCF values of $46.6 and $125.3. A 20% earnings growth path alone did not explain those prices. The difference indicates an expectations premium, but the data cannot establish interest rates as its sole cause.
In 2022, Non-GAAP EPS reached $4.07, its peak in the supplied period. Despite the discount rate rising to 12.0%, the Non-GAAP and GAAP DCF values were $154.0 and $136.9. The price of $123.18 stood below both. Among the observations with positive EPS, this was the year with the smallest relative gap between price and DCF. Stronger earnings and a higher discount rate occurred together; earnings and share prices need not move in the same direction.
During 2024–2026, a lower earnings base and high discount rates weighed on the model. Non-GAAP DCF values fell to $83.2, $60.3 and $54.8, while prices were $403.84, $449.72 and $354.11. The absolute gap was largest in 2025 and remained substantial in 2026. The 2019 DCF value of zero is a rule for non-positive EPS, not a statement that the enterprise had no value.
Revenue growth and earnings growth are different
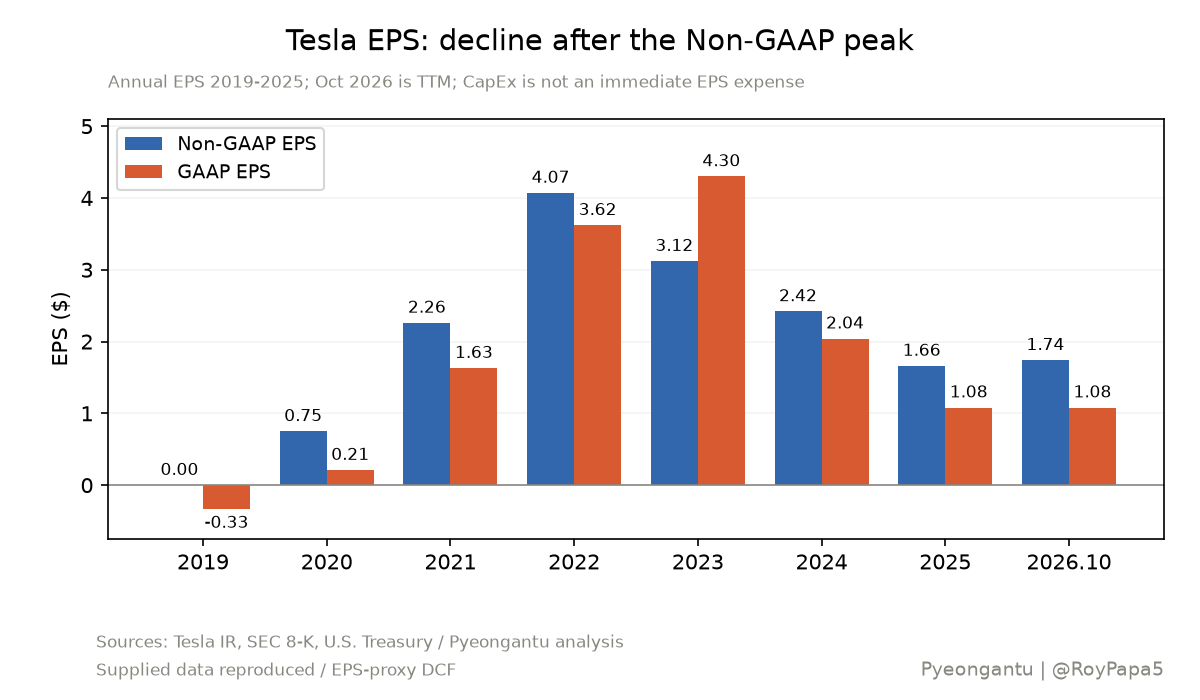
Non-GAAP EPS declined from $4.07 in 2022 to $1.66 in 2025; the October 2026 TTM figure is $1.74. GAAP EPS stood at $4.30 in 2023, $2.04 in 2024, and $1.08 in both 2025 and the 2026 TTM period. Explaining the difference requires examining the adjustment items; their individual amounts require further verification. The 2026 TTM figures also have a different reporting period from the earlier annual figures.
According to the supplied data, Q2 2026 revenue was $28.2B, up 26% year over year, but operating income fell 57% to $398M. The operating margin was 1.4%. Non-GAAP EPS fell 18% to $0.33, below the $0.54 consensus. Higher revenue did not translate into better earnings.
Price reductions are a possible source of margin pressure to investigate. The supplied data does not quantify selling-price changes or individual cost contributions, so it cannot establish their role in the EPS decline. AI spending must also be separated into expenses and capitalized assets. CapEx of $5.8B, up 142%, directly burdens FCF; it should not be interpreted as reducing EPS immediately by the same amount. FCF of -$1.1B and annual CapEx guidance above $25B make the path to investment returns a key question.
Sensitivity reveals the assumptions embedded in the price
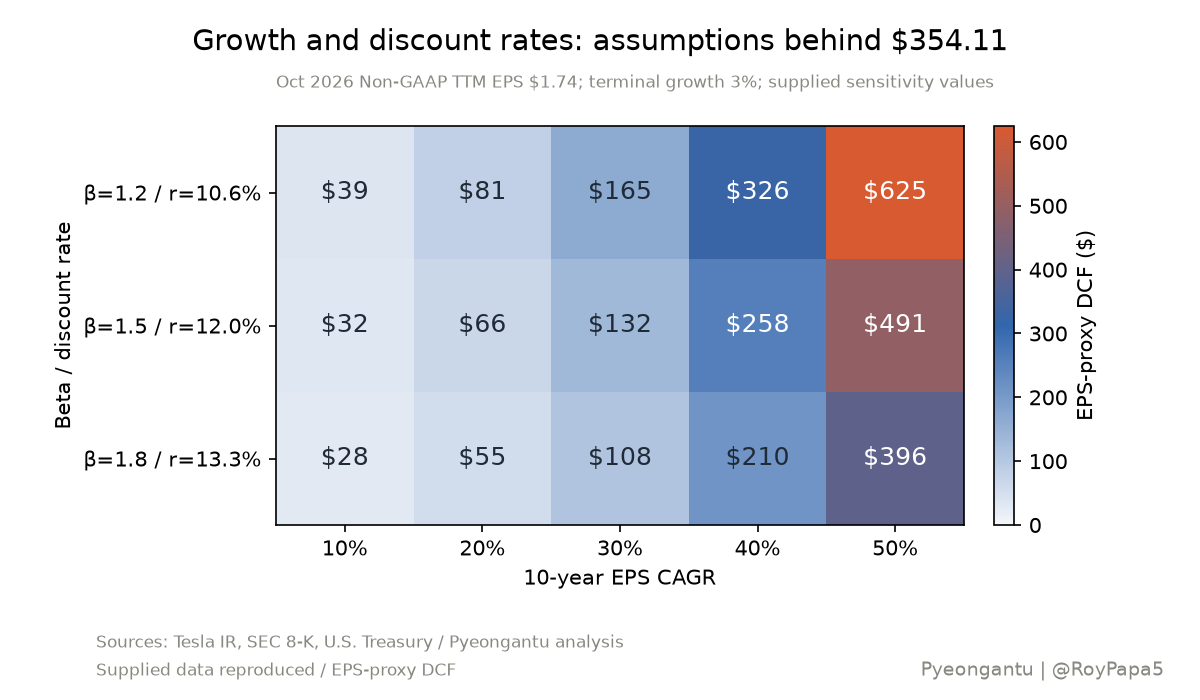
With beta at 1.8 and the discount rate at 13.3%, the supplied sensitivity table gives a value of $55 at 20% EPS growth, $210 at 40%, and $396 at 50%. Under these conditions, the $354.11 share price requires a stronger earnings path than the base case. This is a way of interpreting the price through a common model, not evidence that every investor uses that model.
At 20% growth, the value is $81 with beta of 1.2 and a 10.6% discount rate, or $66 with beta of 1.5 and a 12.0% discount rate. A lower required return supports value, but a gap remains under the base growth assumption. Growth and risk assumptions therefore need to be considered together.
Growth and liquidity: evidence of growth matters more
Within Pyeongantu's GL framework—growth and liquidity—higher interest rates raise the return required from long-duration growth equities. The further Tesla's business returns move into the future, the greater the discounting burden. Treasury yields alone, however, do not establish tightening across the entire liquidity environment. The supplied data directly demonstrates the pressure from higher discount rates.
To offset that pressure, investment in AI infrastructure, Cybercab, Robotaxi and Optimus needs to generate recurring revenue and earnings. Production launches and service expansion are progress toward that outcome; they do not guarantee sustainable profitability or cash recovery. Investment costs, operating costs and the timing of monetization also need evidence.
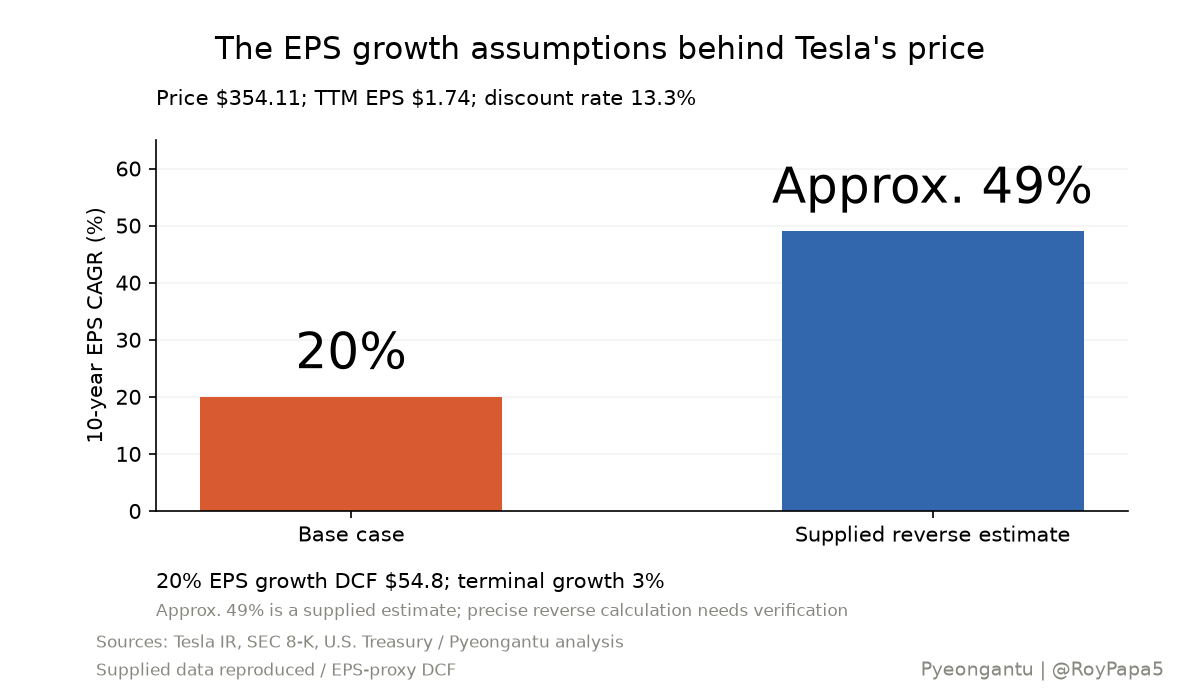
The supplied reverse-DCF estimate suggests approximately 49% annual EPS growth over the next 10 years to support a price of roughly $354, compared with the 20% base assumption. Approximately 49% is a supplied estimate. A precise reverse calculation reconciling the displayed discount rate, DCF table and formula requires further verification. It is neither a confirmed business forecast nor a price target.
Five items to check in the next earnings release
The supplied data places the next release in late October 2026.
- examine whether the operating margin improves from 1.4% and why.
- check whether FCF recovers from -$1.1B through stronger operating cash generation.
- compare the pace of the CapEx plan above $25B with investment-specific monetization schedules.
- assess paid Robotaxi and FSD usage, operating costs, profitability and Optimus commercialization; the relevant figures require further verification.
- monitor whether changes in the U.S. 10-year Treasury yield ease the discount-rate burden.
Future business options alongside automotive earnings
Interpreting the current price requires considering automotive earnings together with the future option value of Robotaxi and Optimus. The gap from the base DCF suggests expectations beyond the existing earnings path. It does not provide a basis for allocating the entire difference to a particular business or converting it into a probability of success.
Investment can create future earnings, but commercialization delays and weak profitability can postpone cash recovery. With a high discount rate, delay itself reduces present value. Pyeongantu's safe-investing question is whether observable business results substantiate the pace and persistence of growth required by the price.
This article is not an investment recommendation. Results can vary substantially with the assumptions.
Sources and model scope
This article compares assumptions using the supplied price, EPS and interest-rate table. The supplied DCF values and approximately 49% reverse estimate do not exactly reconcile with the displayed formula and require precise recalculation. EPS is not shareholder cash flow, and the gap is not a verified value for any individual future business.